On-balance volume (OBV)
Different indicators provide valuable information about market trends and investors’ behavior when it comes to trading or investing in stocks. Notably, technical indicators offer a forecast of future market actions based on the performance of the selected assets in the past . Among the existing technical indicators, on-balance volume is considered particularly useful . Therefore, the following paper describes the principles of on-balance value function, and explains how an investor can use this indicator in trading or investing in stocks.
On-balance volume relates the volume of trades and price changes, accumulating the changes to the price of a selected asset daily. OBV is based on the simple principle that it adds the volume when the closing price on the market is higher and subtracts the same volume when the market closes on lower prices . Joseph Granville was the author of the concept of on-balance volume, and he introduced this indicator in 1963 in his book titled “Granville’s New Key to Stock Market Profits”. Thus, the resulting line can be placed on the stock price chart of a company to predict the future direction of the price course.
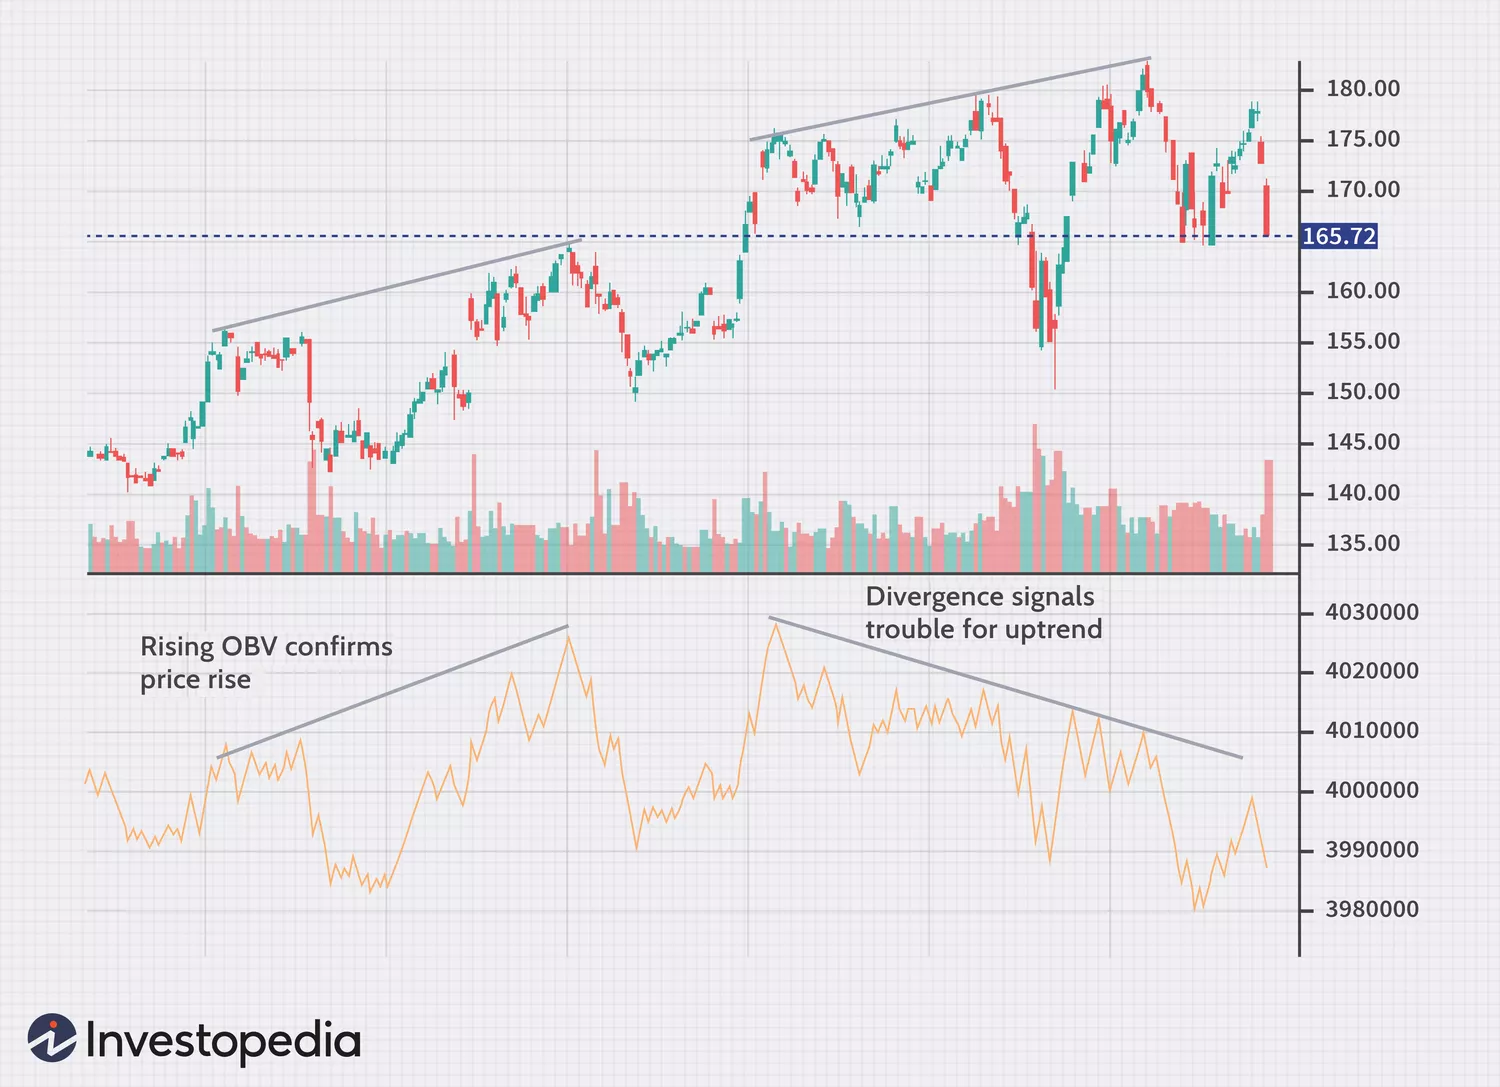
On-balance volume is primarily used for confirming trends. Therefore, if a stock’s price is rising, and so is the on-balance volume line, it means that the price tendency is supported by the volume of the bought shares, which is a bullish signal . In case the price is increasing, but the OBV line goes downwards, it means that the volume is not confirming the upward price movement and chances are the price will fall .
In the example of trading using on-balance volume, an investor can look closer at a tech company called Tech Innovate. The price of the company’s stock began to rise in the beginning of 2023. Looking at the OBV line, an investor would find that the indicator was ascending as well, which means the increasing pressure of buying. Based on this information, the investor could decide to buy shares. Two month later, the stock price increases by 15% and the OBV is still ascending. The decision taken using the on-balance volume could be profitable. Here are some more tips on how to use this indicator in practice:
-
Determine the existing tendency: Is the OBV going up, down or is it flat?
-
Compare with the trend of the stock’s price.
-
Use another indicator such as Bollinger Bands or Moving Average to compare their signals.
Accumulation/distribution (A/D) line
As any investor who ventures into stock market operations, one should be knowledgeable about the Accumulation/Distribution Line. It offers insights into the cumulative money flow in and out of a stock, which can influence the final decision.
Description of the Indicator: Key Features
Accumulation/Distribution Line is a volume-based indicator created to gauge the money cumulative flow in and out of a security. It was established to guide traders in identifying divergences that could suggest reversals. As such, when the stock closes above the midpoint of its day’s high-to-low range, indicating that more money is accumulated, the indicator moves up. It moves down when the stock closes below this midpoint, showing the decrease in money value.
Method or Technique
The method of employing the A/D line involves watching its movement in comparison with the stock’s price. One should follow both indicators and notice the divergence between them. If the stock makes new highs and one sees that the A/D line fails to attain this maximum value, such a trend is feeble and not supported by a strong buying side
Employment Example
As an example, consider the Green Energy Corp. company that has generated its all-time highs in the middle of 2024. Meanwhile, the A/D line produced lower highs, which is a typical divergence and signal that one needs to sell the share, or at least, do not buy, wait, and see. Indeed, at this moment, the stock’s price started to decrease, and the indicator displayed the correct fluctuation of the market, showing the imbalance between selling and buying and the necessity of stopping and delaying.
Best Use of Tool
The usage of the A/D line implies that it should be combined with other indicators for more reliable and prominent indications. As such, in A/D analytics, it is vital to:
-
Monitor the A/D line’s moves in relation to stock price movements.
-
Watch out for divergences, as such signs tell us that the trend’s momentum might be drying up.
-
Use it in combination with other tools, such as the RSI, to confirm trends and anticipate reversals.
Average Directional Index
The Average Directional Index is an indispensable trading tool for those investors who are interested in market strength and trend direction. This particular indicator was devised by J. Welles Wilder in 1978, and it allows the investors to evaluate whether the market is exhibiting a strong trend either upwards or downwards. The average directional index incorporates two other indicators, including the Positive Directional Indicator and Negative Directional Indicator . The former two provides information about the strength and direction of the trend, while the ADX itself only helps to evaluate the strength of the trend, but no specifics about the direction. Generally, values above 25 are considered as a strong trend, while below 20 is weak.
The first tactical step with the ADX indicator does not only involve figuring out whether the ADX is high or low. The other step involves figuring out whether +DI is crossing -DI. The crossing of +DI above -DI implies the beginning of an uptrend. In contrast, -DI crossing above +DI represents the start of a downtrend.
Let us consider an illustrative example with ADX. Assume that “Global Tech Inc.” is a hypothetical technology company. In early May 2024, the stock of Global Tech shows an ADX value rising above 25, and at the same time +DI crosses above -DI. Consequently, we have a strong uptrend. On the is basis, the trader decides to buy the shares. Over the next few weeks, the ADX indicator remains strongly above 25, and the price rises by 20%, while in the meantime, +DI remains above -DI. Thus, the strength of the trend and is direction has been accurately assessed by ADX.
To utilize the power of the ADX indicator, the traders could take the following steps:
-
The ADX and DI and DI- values should be regularly monitored. The crossing of DI lines is a sign for potential exit or entry points.
-
Combine the ADX with the Moving Average and the RSI indicator.
Aroon Indicator
The Aroon Indicator is a powerful tool for traders. It can tell you when a trend is likely to start and how strong it is or when a trend is changing or if the stock is entering a trading range. Developed by Tushar Chande in 1995, the Aroon Indicator is based on the time between highs and the time between lows for a given period.
Basics of the Aroon Indicator
The Aroon Indicator consists of two lines, the Aroon Up and the Aroon Down. For each line, we measure the time, as a percentage, that has gone by since the stock reached its highest or lowest prices within a predetermined time period, commonly 25 days. A percent close to 100% means a strong trend and close to zero means a weak trend.
Strategy of the Aroon Indicator
Thus, traders use the Aroon Indicator to try and see a shift in the momentum of a stock. If the Aroon Up line crosses above the Aroon Down line, it means the bullish momentum of the stock is likely to increase in the near future. It is a buy signal. Conversely, if indeed the Aroon Down line crosses the Aroon Up line, it means the bearish momentum of the stock is likely to decrease and one might consider selling.
Example: Aroon Indicator in Action
Imagine “Clean Energy Fuels Corp” is an energy company. One day in late 2024, the stock starts showing a scenario where the Aroon Up is rising to 95 and the Aroon Down is falling to 5. This indicates a very bullish momentum. You rely on this data and take a long position on it. Over the next month, the stock starts climbing hugely, up by over 50%. The ability to determine the signal and act on that clearly enriched you.
How to successfully use the Aroon Indicator: Watch the crossover points: These are crucial signals that should help you buy or sell. . Watch the percent value: Above 70% and below 30% show thresholds for strong moves versus fade moves. . Combine with other indicators: There are special signals when used with some early volume indicators or oscillators like the MACD.
MACD
The Moving Average Convergence Divergence is one of the most popular and reliable indicators of stock market analysis. Created by Gerald Appel at the end of the 70s decade, the tool helps traders to understand the momentum and trend directions of stocks. As a result, it is a dual-purpose device that is irreplaceable to take only weighted decisions while trading.
Description of MACD
MACD is a trend-following momentum indicator that illustrates the relationship between two moving averages of a stock price. Mitchel writes that the indicator consists of two parts, including the MACD line and the signal line. The MACD line is created by subtracting the 26-period Exponential Moving Average from the 12-period EMA. The signal line becomes the 9-period EMA of the MACD line and serves as a trigger for buy and sell signals.
How it can be used to analyze the prices?
In general, MACD is effective when it fades away from the price of stock. A bullish divergence happens when MACD forms two rising lows which correspond with two falling lows on the price of the stock. It means that the bullish momentum is going up, and the price may begin to rise. A bearish divergence occurs when MACD forms two falling highs wounds correspond two rising highs on the price of the stock. It is a signal of a potential downtrend.
Example: how it works in practice
Inaction, we can use the next example. Imagine that there is a fictional tech company, which name is “Virtual Reality Corp.” The price of one share is constantly changing, and as for March 2025, the analysis of MACD proves the bullish divergence: the MACD line crossed above the signal line while the stock price hits the lower low. Almost without a doubt, it will be a strong buy signal. If a trader does buy stocks at that time, after a while, he will be able to see that the price is really rising, turning the MACD signal into profits.
Tips on How to Use It Carefully
To derive the most utility from MACD, traders need to remember the next points:
-
the indicator is designed to look at the crossovers and observe the divergence
-
searching for crossovers of the MACD and the signal line to understand that it is a potential point to buy or sell
-
it is useful to trace divergence as one of the signals of the potential change of trends
-
MACD is better when combined with other technical tools , for example, RSI or ADX , to take a more multifaceted view and reduce the number of false signals.
Relative Strength Index
The Relative Strength Index is a vital technical indicator used by traders to indicate the speed and change of price movements pointing out overbought or oversold conditions. Made by J. Welles Wilder in 1978, the RSI has since then become a critical part of momentum trading .
Breaking Down the Relative Strength Index
As indicated in the provided description, this indicator is a momentum oscillator measuring the magnitude of recent gains in that asset compared to recent losses to determine the overbought or oversold conditions of that asset. The RSI values typically differ between 0 to 100. Usually, with the value of the asset above 70, that asset is deemed overbought, and with it being below 30, it’s underbought.
Analytical Strategies with RSI
The potential in using RSI comes from its ability to indicate potential reversal points. For instance, if the RSI of a stock soars over the 70 threshold, that stock might be overbought, indicating a soon upcoming pullback. Though, vice versa, if the RSI of a stock or asset declines below the 30 threshold, suffering from undervaluation, another value bouncebackment is seemingly nearby.
Case Study: RSI as an Investment Device
Imagine a company called “FutureTech Industries”. In April, 2025, the company’s stock goes through the roof, pushing the RSI to 75. As an aforementioned wise investor, I look at the RSI of the stock and sell my stocks due to the RSI’s predictions of it being overbought. Subsequently, I am proven correct as the stock of FutureTech Industries plummets down by 10%.
Appropriate Usage of the RSI
To ensure maximum use in trade-related scenarios, be sure to follow the provided guidelines:
-
Keeping an eye on the RSI threshold. 0 Regularly check if the bought levels are crossing the 70 threshold and the sold levels are crossing the 30 threshold.
-
Finding the RSI divergence. This anomaly appears when the RSI direction doesn’t match the price direction, as this might indicate a potential price reversal.
-
Combining with other important indicators. RSI should be frequently in tandem with essential measuring tools such as MACD or the Aroon Indicator which calibrate RSI signals and reduce false positives.
Stochastic Oscillator
The Stochastic Oscillator is a momentum indicator that indicates the position of a stock’s closing price relative to its high-low range in a specified duration. It was designed in the late 1950s by George C Lane and is particularly useful in identifying the overbought and oversold points, assisting the trader to spot possible reversal points in the market. T
he Stochastic Oscillator is characterized by two lines: the %K line that represents the current price in relation to the range and the %D line, which is the simple moving average of the %K line. Generally, they run on values of 14, 3, and 3 in period settings. When the oscillator is at value 80, or above, it suggests that the stock may be overbought and possibly unattractive for a buy. On the other end of the Stochastic Oscillator, value 20, and below suggests the stock may be underbought and as such might be ripe for a buy.
In order to effectively apply the Stochastic Oscillator, it is advisable to concentrate on its crossover points of the %K and %D lines. For instance, one may adopt a buy posture when the %K line line crosses the D line upwards, below the 20 level, suggesting the stock might be bouncing back from an oversold level. On the other hand, it would be advisable to use the Stochastic Oscillator indicator to sell when there is a cross below the D line above the 80 level, suggesting the stock is retreating from an overbought level.
As an example, there is a fictitious airline company, Oceanic Airlines. The company’s stock price falls and Stochastic Oscillator falls below 20 in June 2025 during a very volatile phase of the market . A few days later, %K crosses over the D line from below, below the 20 level . This would have been a major buying point for the investor as they will have gone on to reap huge profits on their buy-side validated by the buy signal given by the Stochastic Oscillator. Some extra points for traders are:
-
Look for divergences: If the price of a stock is going to lower lows and the oscillator is going to higher lows, it is an indication that the market will soon make a U-turn.
-
Use the oscillator together with others: This may increase the chances of the indicator pointing towards clear buy and sell indicators.
-
Concentrate on the levels of the oscillator: If there are continuous readings about 80 or 20, it is an influencer of how strong or weak the trend is.


